![]() Mastt's Cost tiles allow you to easily present your project or program's financial state in a format that makes sense to you and your audience. Using our Table or Chart tiles, you can help your audience understand the project or program's current and forecasted financial status, allowing for better capital controls!
Mastt's Cost tiles allow you to easily present your project or program's financial state in a format that makes sense to you and your audience. Using our Table or Chart tiles, you can help your audience understand the project or program's current and forecasted financial status, allowing for better capital controls!
Cost Table Tiles
Mastt has the following Table tiles available:
- Budget vs FFC Table - showing Payment, FFC progress vs the Budget
- Cash Flow Table
- Contracts Table
- Forecasts Table
- Overall Table - showing the overall finances of the project/program
- Variations Table
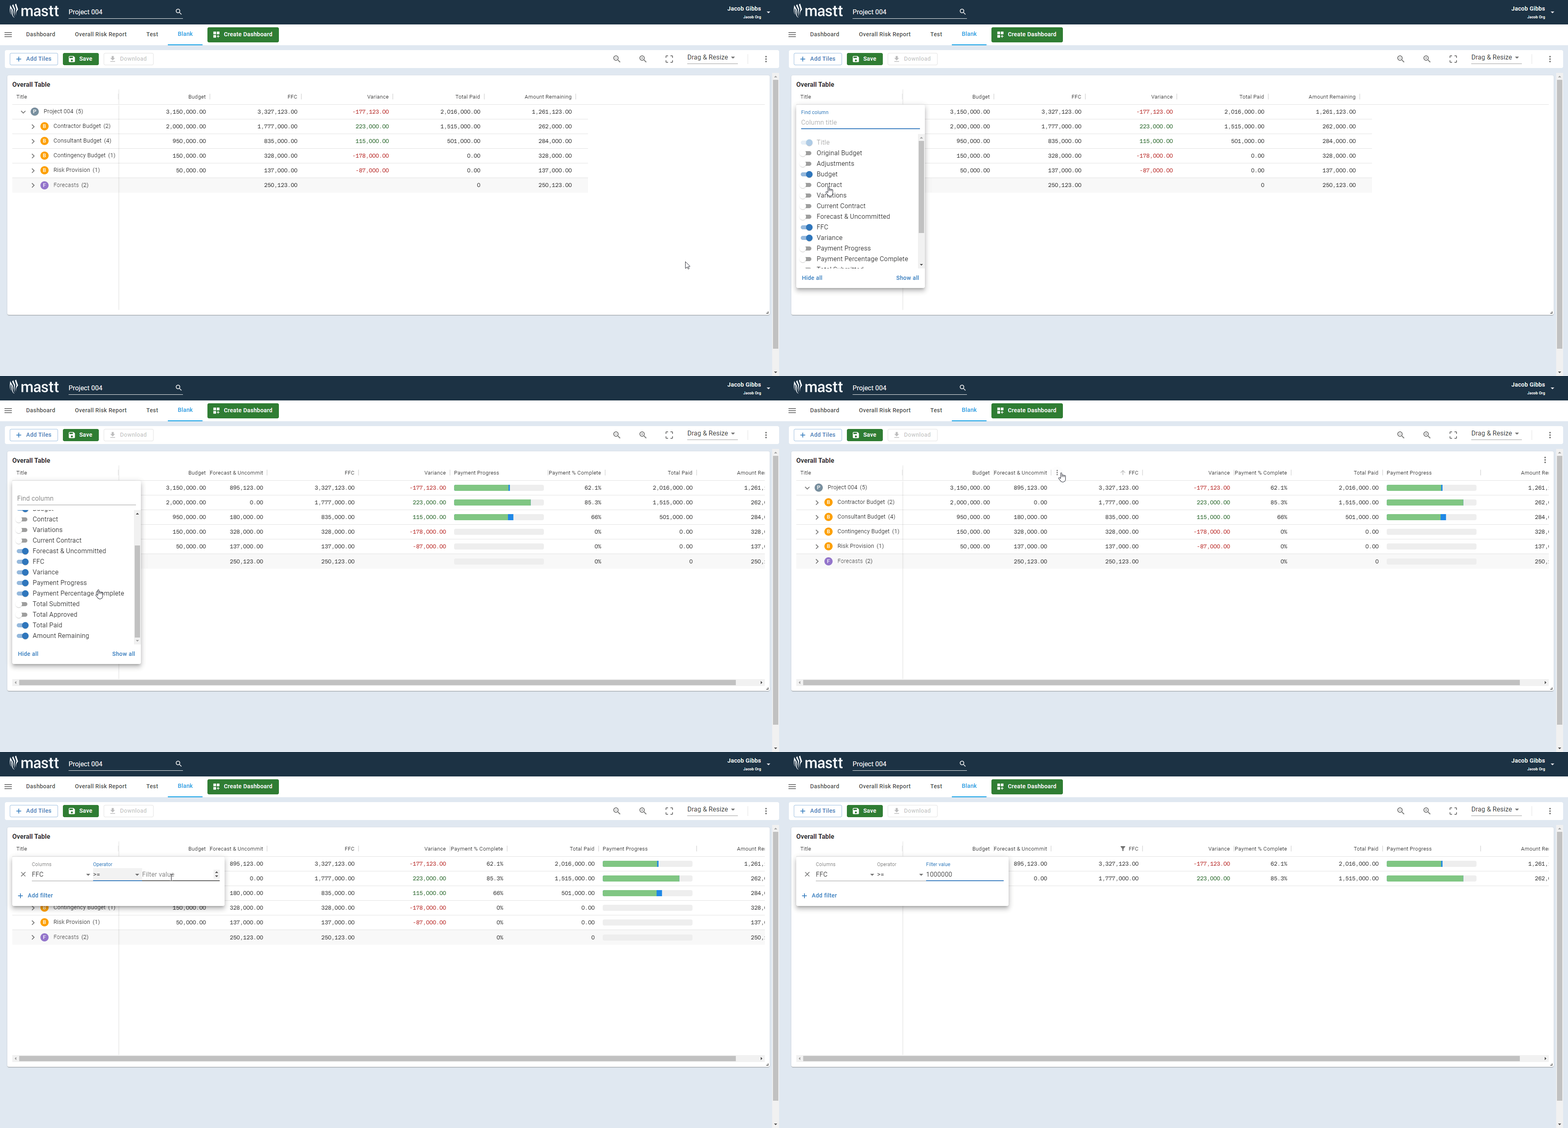
All of these tables (except for the Budget vs FFC Table) allow you to choose which columns are shown and filter within those columns, allowing you to customise the table to the audience:
Cost Chart Tiles
Mastt has the following Chart tiles available:
- Budget vs FFC Waterfall Chart
- Cash Flow Chart
- Cash Flow Variance
- Finance Bubbles
Budget vs FFC Waterfall Chart Tile
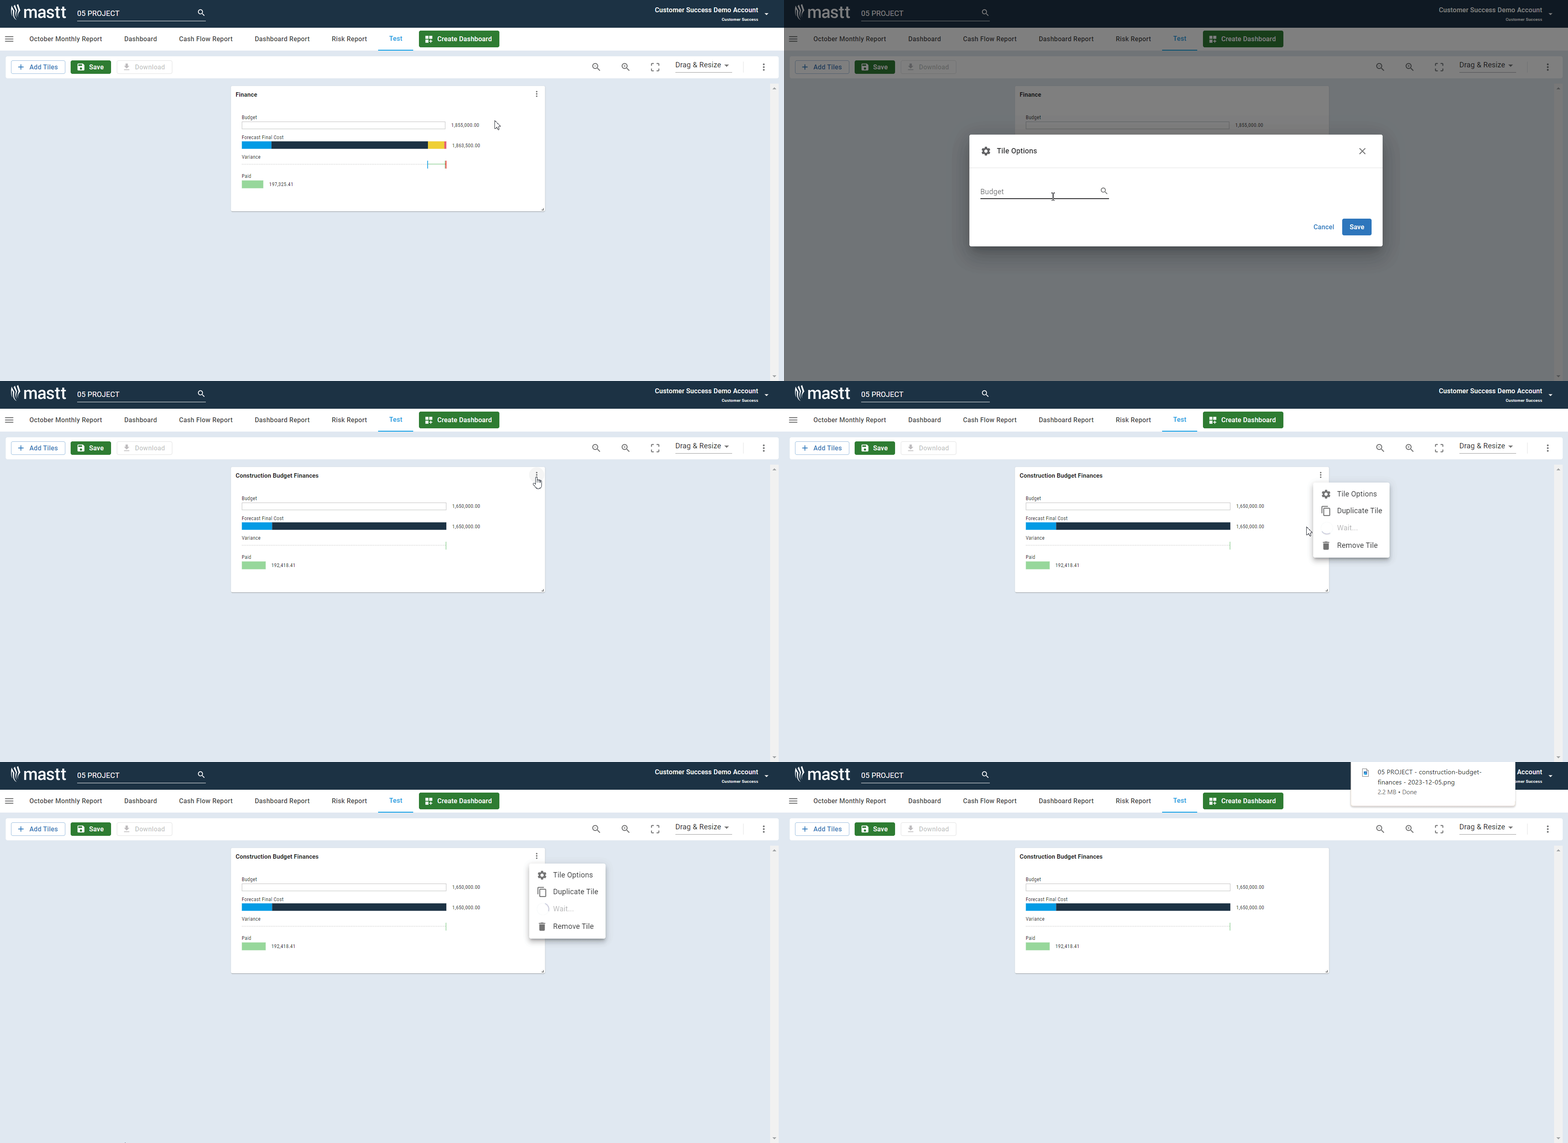
This tile shows the data from the Budget vs FFC table in a Waterfall chart. Through the Tile Options menu, you have the option to select a Budget - allowing you to filter the data to reflect individual Budgets:
Cash Flow Chart
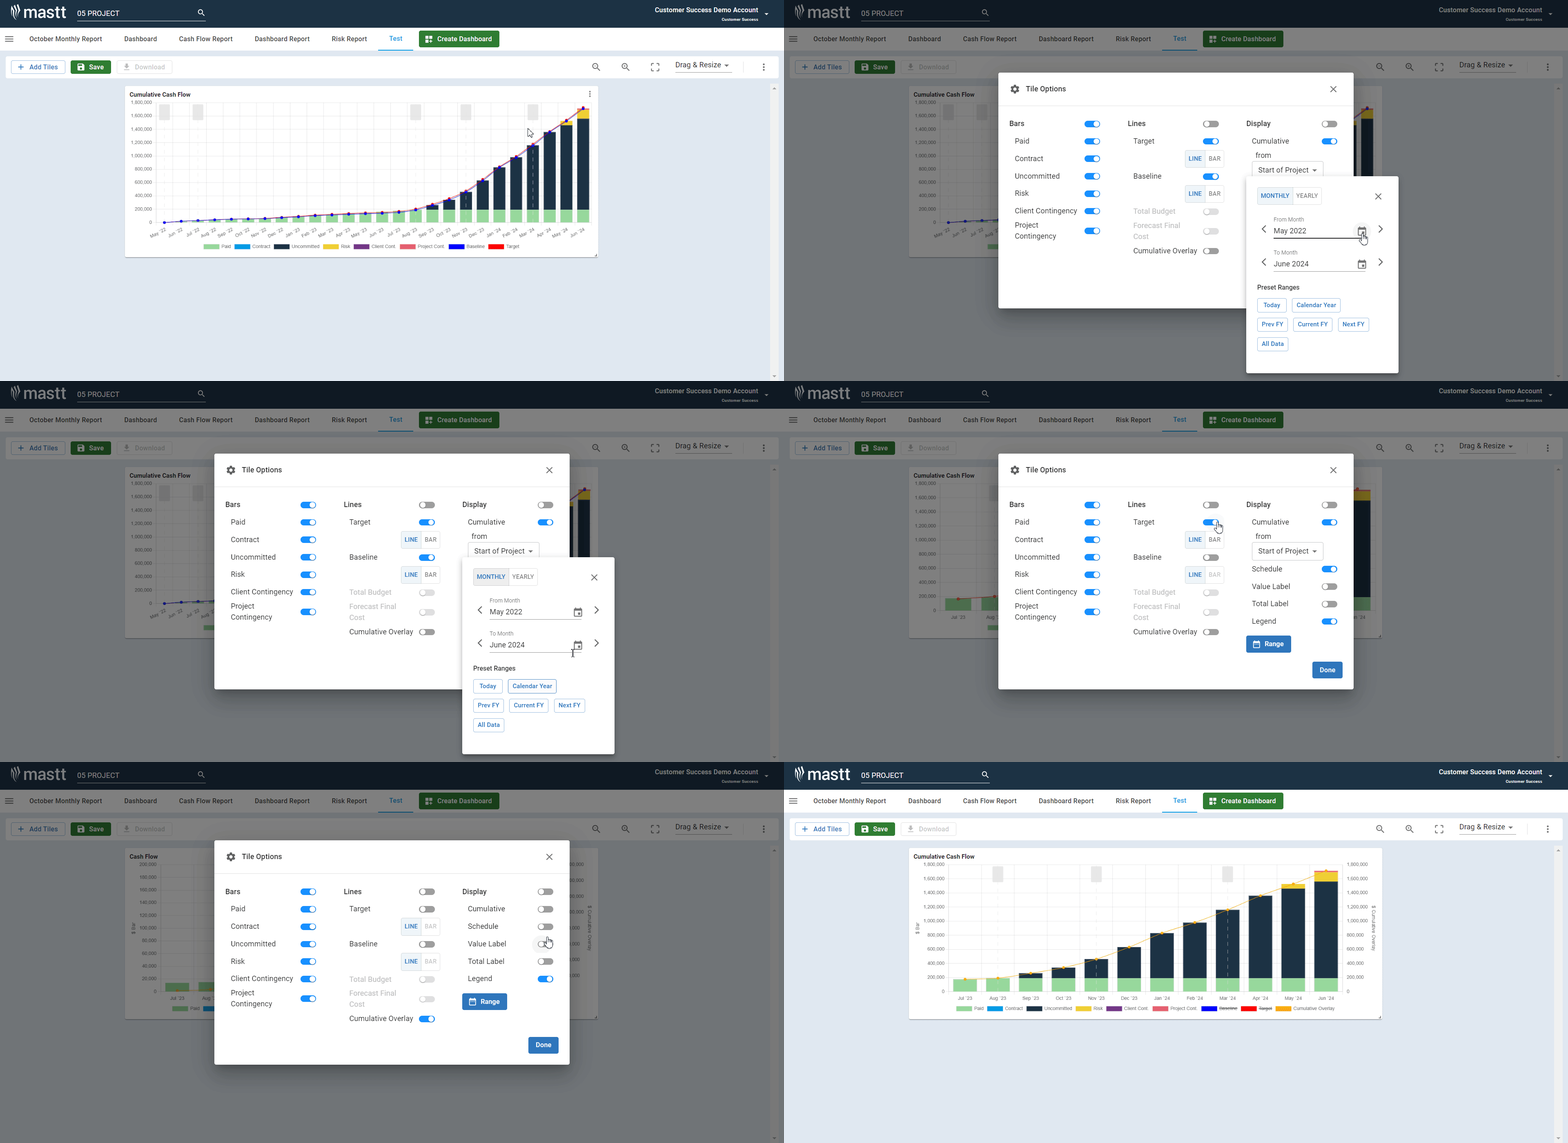
The Cash Flow Chart tile is an incredibly customisable way to represent your project/program's cash flow. Through the Tile Options menu, you can choose the range, which cash flow data is shown, whether it is cumulative, and so much more:
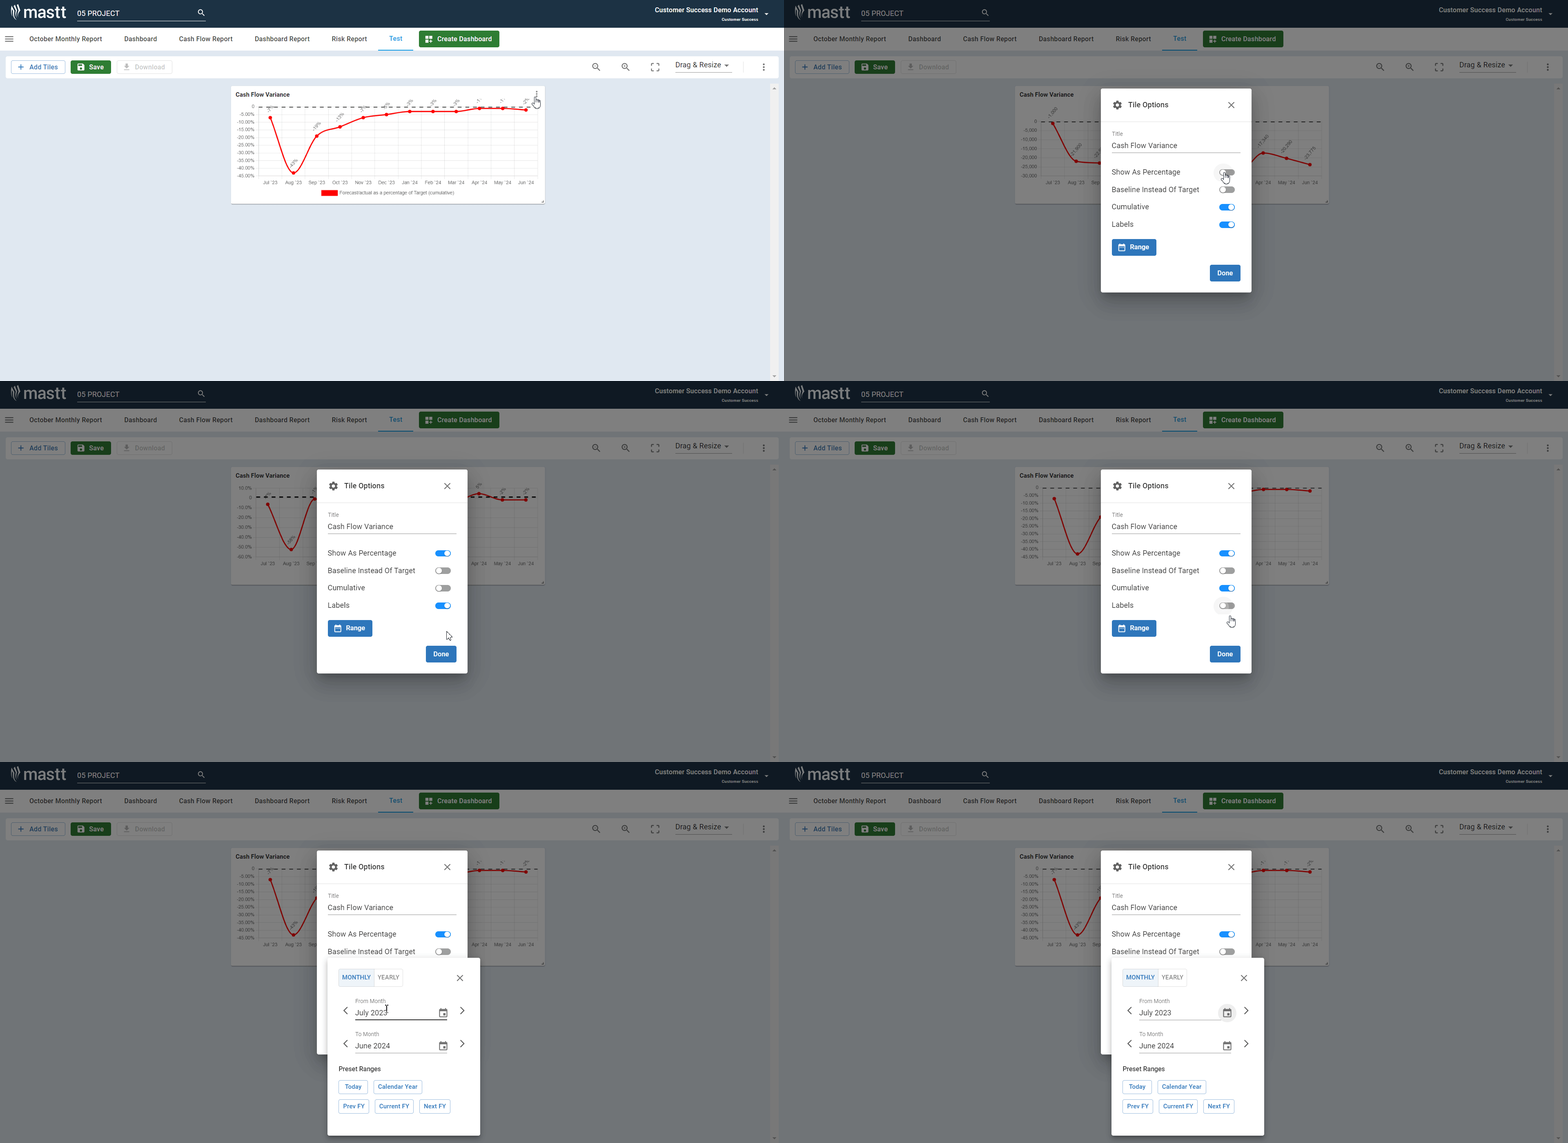
Cash Flow Variance
The Cash Flow Variance tile shows the difference between your target or baseline and forecast/actual amounts. Using the Tile Options menu, you can change the tile title, whether your cash flow is compared to your target or baseline, whether it is a percentage or actual values, if it is cumulative, and if the values are labelled:
Finance Bubbles
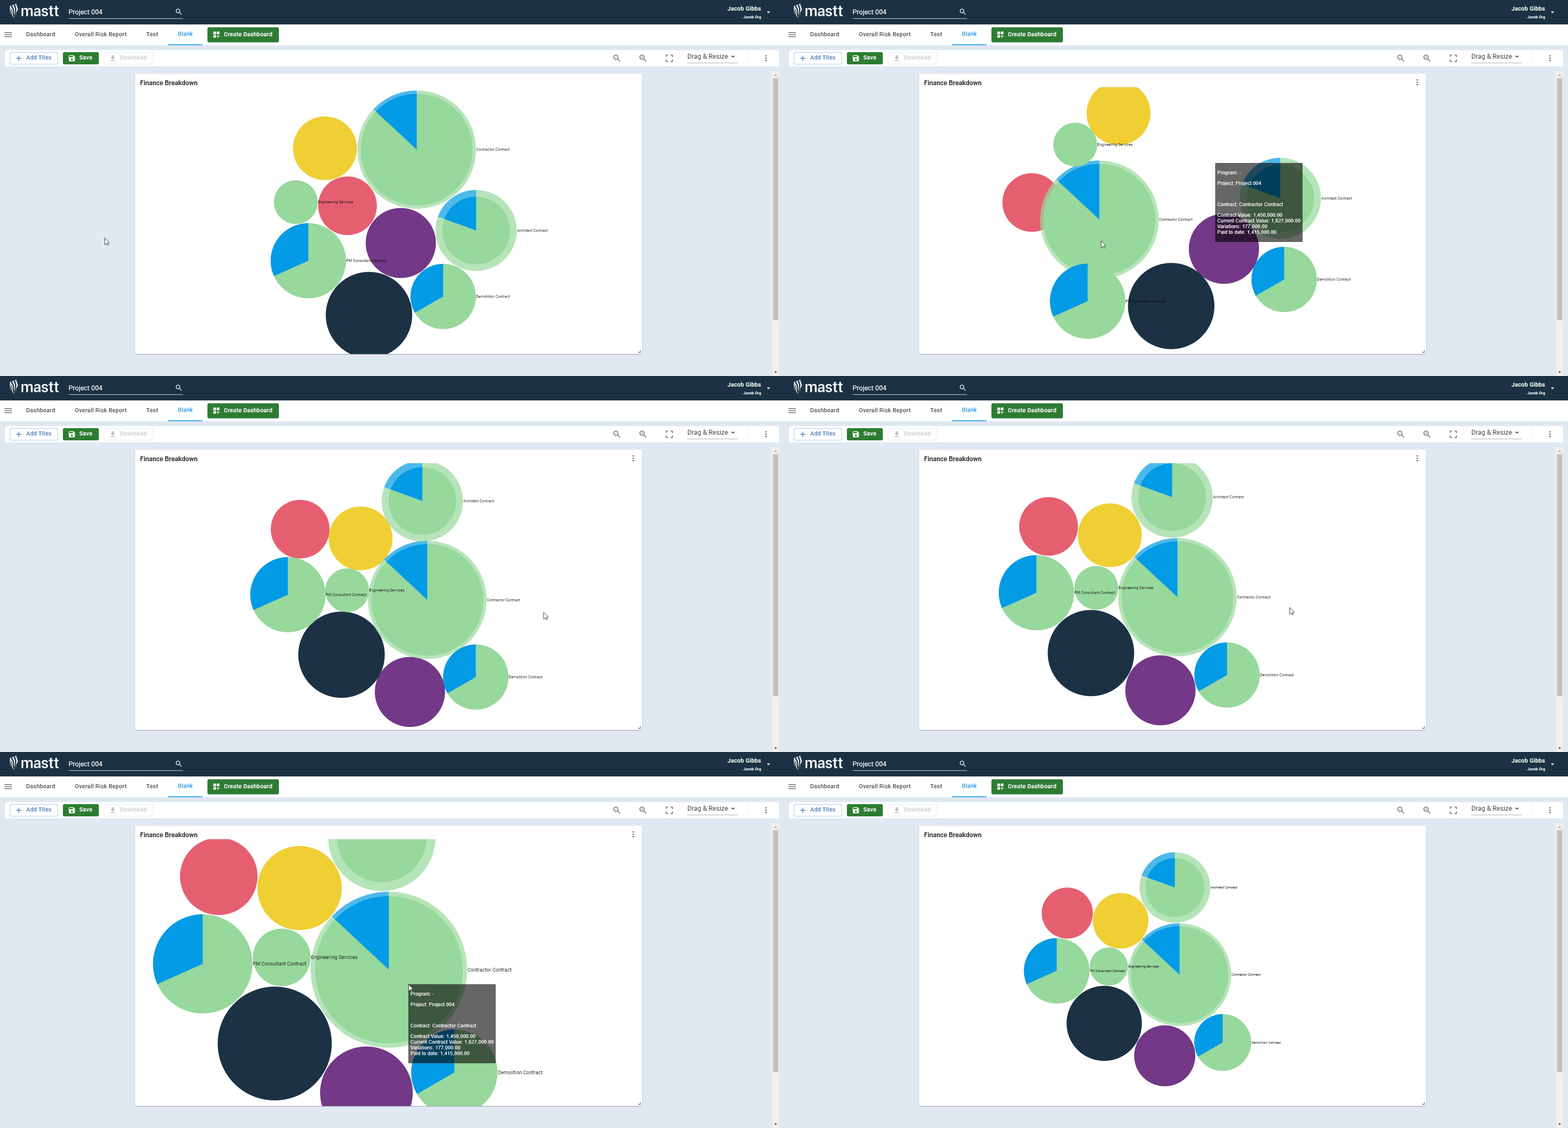
The Finance Bubbles tile shows the relative size of your contracts and forecasts, the percentage paid (shown by the Green section of the bubble), and the size of the variations (shown by the Shaded area around the bubble). You can move the bubbles around by clicking and dragging, zoom in and out by hovering your cursor over the tile and scrolling in and out, and can see the values by hovering your cursor over the bubble:
