
Easily monitor your program schedule milestones with the help of a centralised report, ensuring efficient management of your projects.
 Overview of Program Schedule

What is the purpose or value?
This will give you a centralised report by getting all the important milestones and data in one place. Don't wait until the end of the month to receive milestone updates; the program will be transparent and visible at all times. Gain insight into the activities and milestones of the previous month, as well as what is planned for the upcoming months or quarter. This will help you effectively prepare and identify opportunities to contribute value to the program.
Identify milestones and project interdependencies to deconflict or make valuable programmatic decisions. Save time when preparing reports!
Program-wide slip/gain to generate lessons learned about key milestones or dates to inform future project decisions.
Useful Tools:
| Filter the Program Schedule by Project, POC, Phase, Year Range, and Milestone. |  |
|
See Milestones from a template only
|
 |
| Toggle on or off Monthly View |  |
| Show or Hide Chart |  |
| This allows you to extract the Program Schedule data in an Excel format quickly. |
 |
|
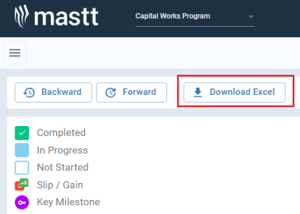
Backward and Forward Switch between current, previous, and upcoming fiscal years (FY) easily. |
|
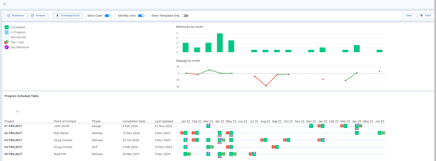
Program Schedule Chart legend
|
 |
| Multiple Milestone The +1 icon will be visible if several milestones happen in the same month. |
 |
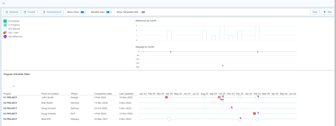
| Program Schedule Table It gives you the ability to keep track of the Project, Point of Contract, Phase, and Last Updated date. You can use them to see if the data you're looking at is up to date, and if it isn't, you can easily contact the POC to request an update. |
 |
Utilise the Program Schedule by following these easy steps:
How to access the Program Schedule
Navigate to your 'My Account' page, then choose 'My Programs'. From there, select the specific program you are interested in and access the Schedule by using the quick links. Simply click on the three dots menu and choose the Schedule option to view the program schedule.

How to Sort and Filter the Program Schedule
Sort:
You have the ability to organise milestones and track slippage by month by utilising the arrow located within the Program Schedule table. Click on the top column header, and an arrow will appear to help you sort the data efficiently.

Filter:
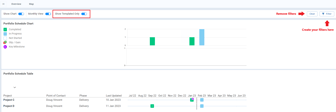
You can customize your program schedule by filtering milestones, phases, dates, and other important details to effectively oversee and monitor your progress.
Step 1: Within the Program Schedule page, choose 'Filter' to show the filter menu.
Step 2: When the Filter menu appears, you can begin filtering the Project, Point of Contact, Phase, Year Range, and Milestone.
You can also filter multiple milestones based on your preferences.
Remove the filter by clicking the 'Clear' button.
To save, click the Filter button at the bottom of the filter menu.
Other actions:
Explore additional features to effectively manage and monitor your program schedule.

Show Templated Only
| ON | OFF |
|---|---|
 |
 |
Monthly View
| ON | OFF |
|---|---|
 |
 |
Show Chart
| ON | OFF |
|---|---|
 |
 |
Backward and Forward
| PREVIOUS FY | NEXT FY |
|---|---|
 |
 |
Download Excel
This feature enables you to efficiently extract the data from the Program Schedule and save it in an Excel format.
Step 1: Click Download Excel.
Step 2: Open the downloaded Program Schedule Report:
Navigate to different tabs to view the Racehorse, Grid, and All summary reports.

Got questions or need a hand? Send us a Support Ticket! Our team is ready to help!