How to Add and Configure Big Number and Schedule Metric Tiles
Complete guide to dashboard tile configuration for construction project management
Dashboard tiles help you display critical project metrics at a glance on your Project or Program Dashboard. Use Big Number tiles for key cost figures and Schedule Metric tiles for important timeline information.
Before you start:
- Cost data entered in your Cost Module (for Big Number tiles displaying cost metrics)
- For Schedule Metric tiles: baseline and planned dates entered for activities with an identified completion activity
Steps
Add a tile to your dashboard

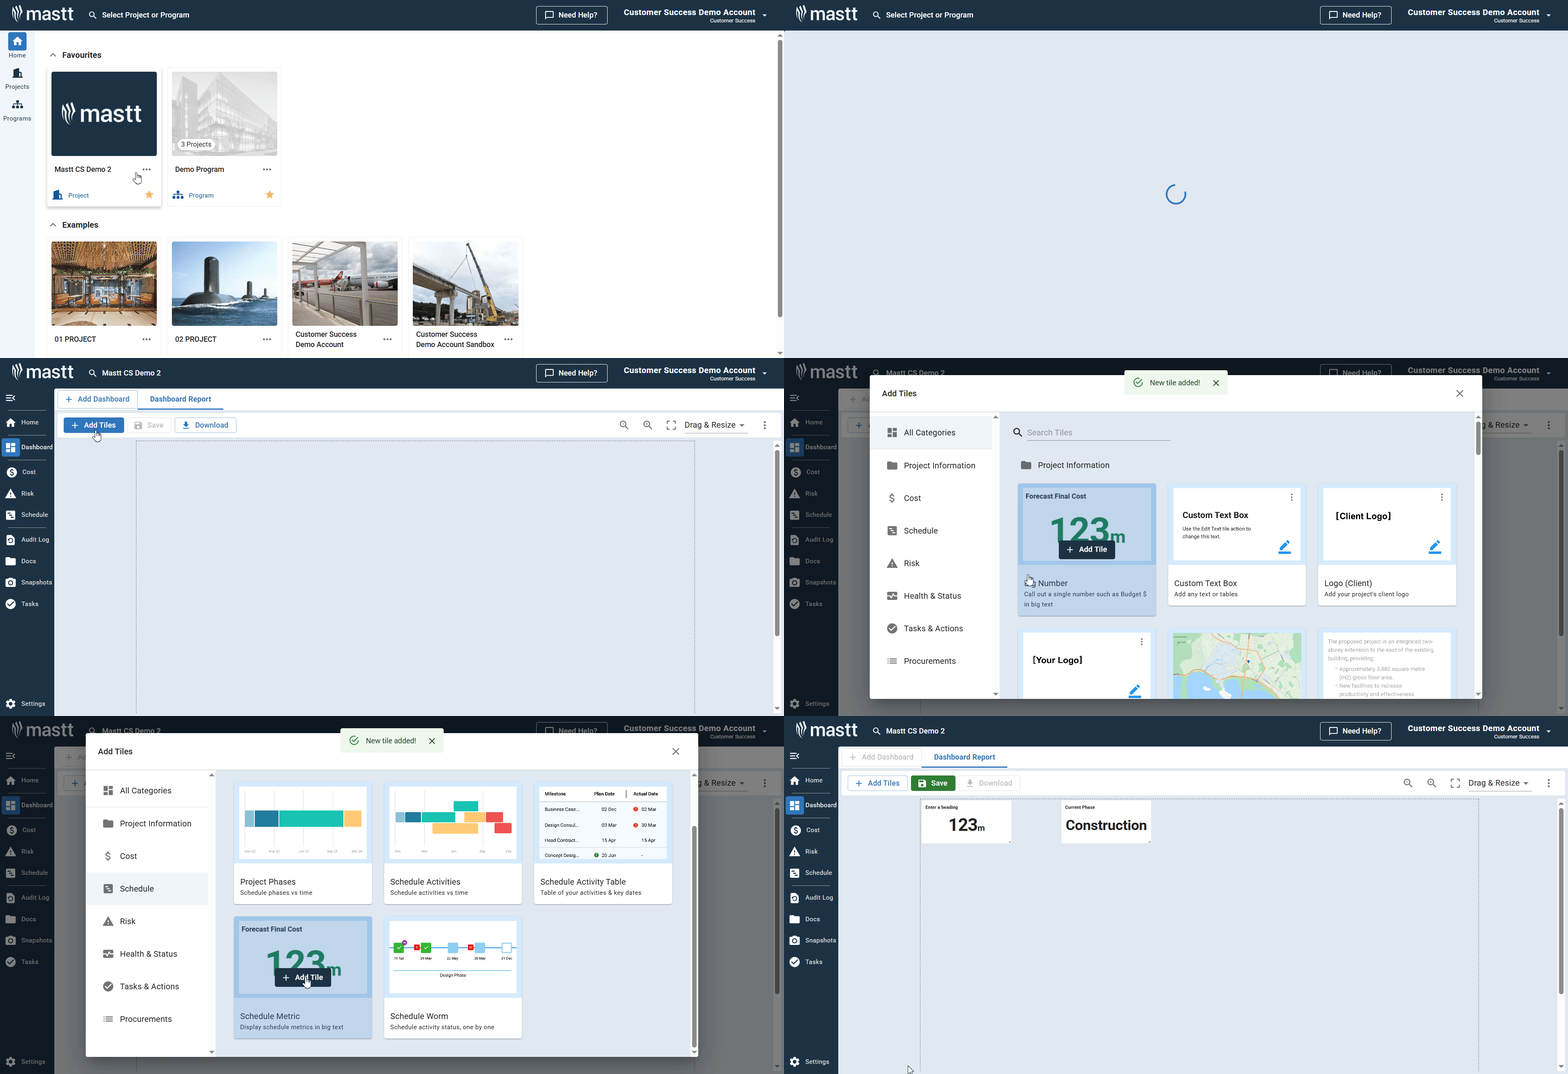
- Navigate to your Project or Program Dashboard by clicking the Side Menu icon and selecting Dashboard
- Click the + Add Tiles button
- Locate either the Big Number or Schedule Metric tile in the Tile Library
- Click + Add Tile on your chosen tile type
- Click the X to close the Tile Library
Configure Big Number tiles

- Click the Three Dots in the top right corner of your newly added tile
- Select Settings from the dropdown menu
- Under Which number? select a data source from the Cost Module or choose Custom to enter a custom value
- Optionally add or subtract another number to display sums or differences
- Enter a Heading to display above the number
- Select Denominations from the dropdown (None, Thousands, Millions)
- Set the number of Decimal Places to display
- Choose a Colour from the palette
- Click Save to apply changes
Configure Schedule Metric tiles

- Click the Three Dots in the top right corner of your newly added tile
- Select Settings from the dropdown menu
- Under Which metric? select from Current Phase, Baseline Completion Date, Planned Completion Date, or Delay from Baseline
- Toggle Custom title? if you want to change the tile title
- Choose a Colour from the palette
- Click Save to apply changes
Manage your tiles
- To edit cost amounts for Big Number tiles, click the Three Dots and select Edit. This will take you to the related Cost Module section where you can modify the underlying data.
- To duplicate a tile, click the Three Dots and select Duplicate Tile. Configure the duplicated tile as needed.
- To download a tile as an image, click the Three Dots and select Download Tile.
- To remove a tile, click the Three Dots and select Remove Tile.
Troubleshooting & FAQ
Q: What if my Schedule Metric tile shows no data?
Ensure baseline and planned dates are entered for activities, and completion activities are properly identified in the Schedule Module.
Q: Why do my numbers appear too large or difficult to read?
Adjust the denomination setting or resize the tile for better readability.
Tips for effective dashboards
Use consistent colours for related metrics to create visual groupings. Keep headings concise and descriptive. For cost tiles, choose appropriate denominations to improve readability. Place the most critical metrics at the top of your dashboard for immediate visibility.