
Health tiles let you manually track project health across seven key categories: scope, time, cost, risk, safety, quality, and cash flow. Use this guide to add health tiles to your dashboard and configure them for effective project monitoring.
Note: Dashboard tile layout changes (moving, resizing, adding, and removing tiles) are autosaved. However, edits made inside tiles, such as health status, commentary, and tile settings, must be saved manually by clicking Save.
Before you start
- You need access to a project dashboard.
- Decide which health tile types suit your reporting needs.
| Tile type | What it shows |
|---|---|
| Health Text | Detailed status and commentary for individual categories |
| Health Rings | Visual ring overview of all health categories at a glance |
| Health Compare | Side-by-side comparison between two reporting periods |
| Health Trend | Historical trend chart over a date range |
Add health tiles to your dashboard
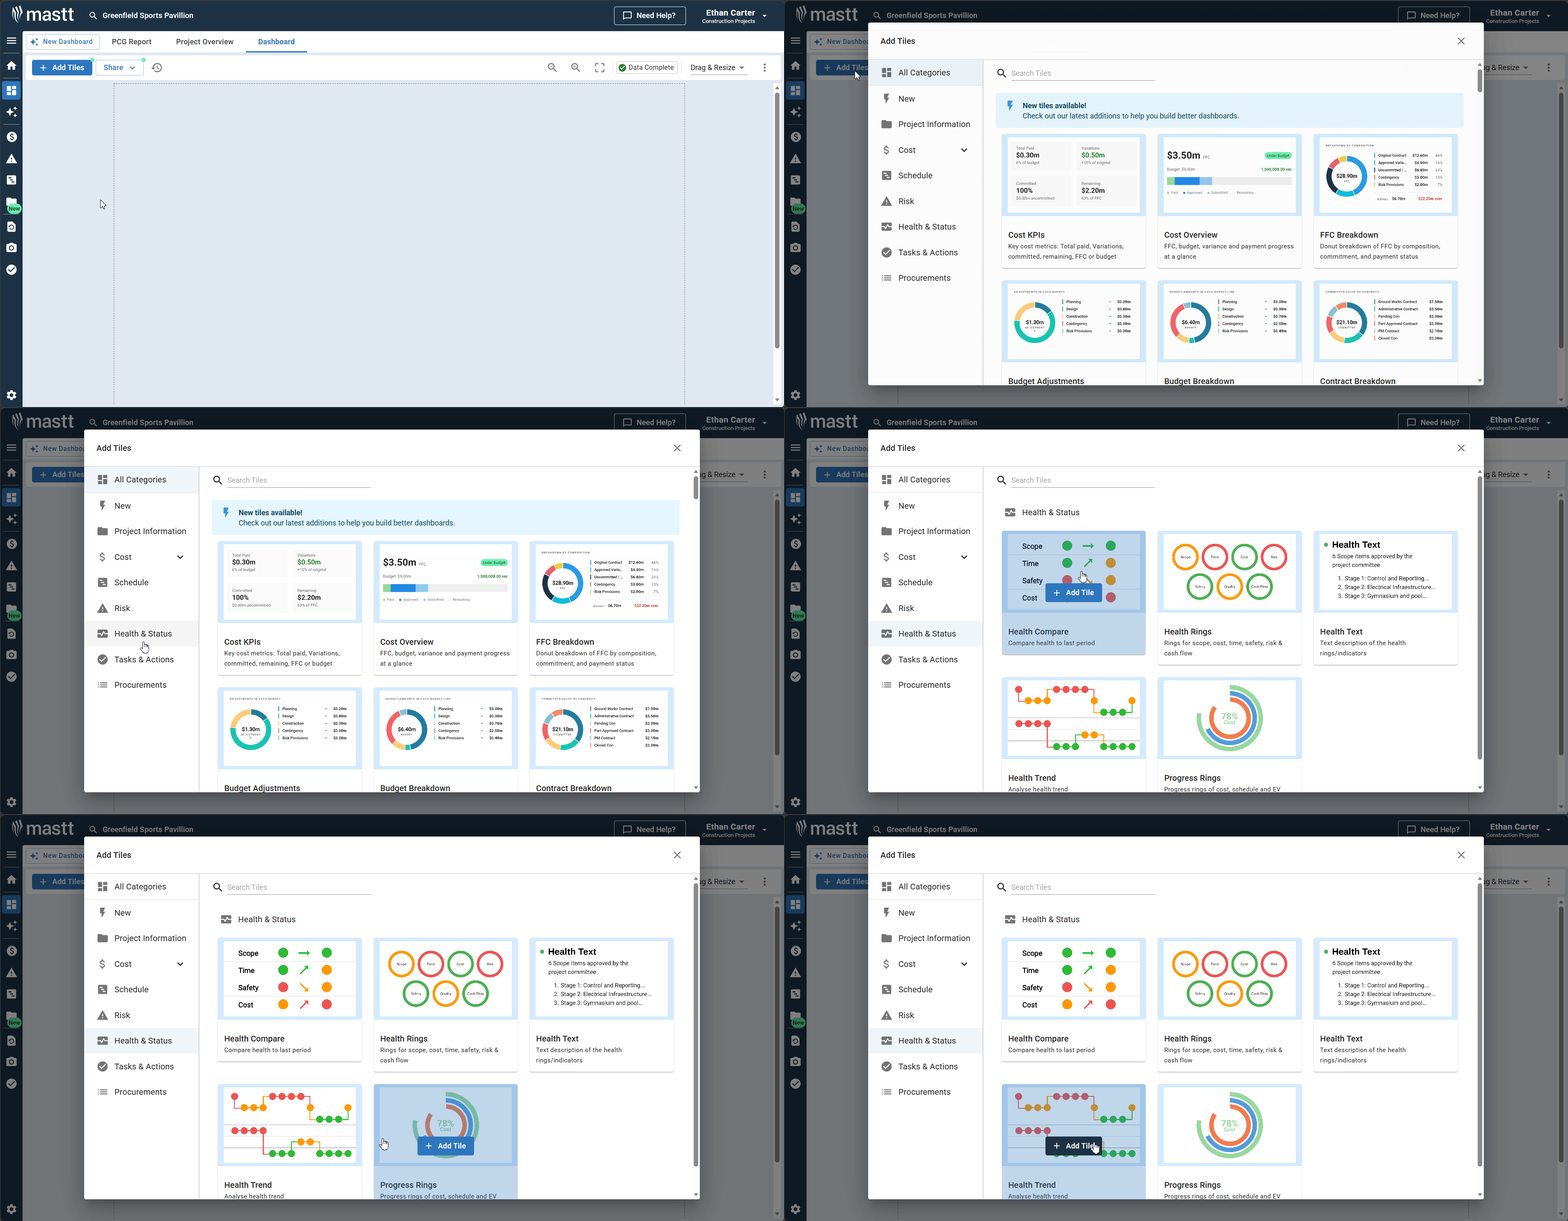
- Go to your project dashboard.
- Click + Add Tiles in the top left corner.
- Select Health and Status from the left-hand menu in the tile library.
- Hover over your preferred tile type and click + Add Tile.
- Click X to close the tile library. The tile appears on your dashboard.
Configure health tile settings
Tip: Each health tile (except Health Trend) can have a custom title. Click the Action button, select Settings, and toggle on Custom title? to rename it.
Health Text tile
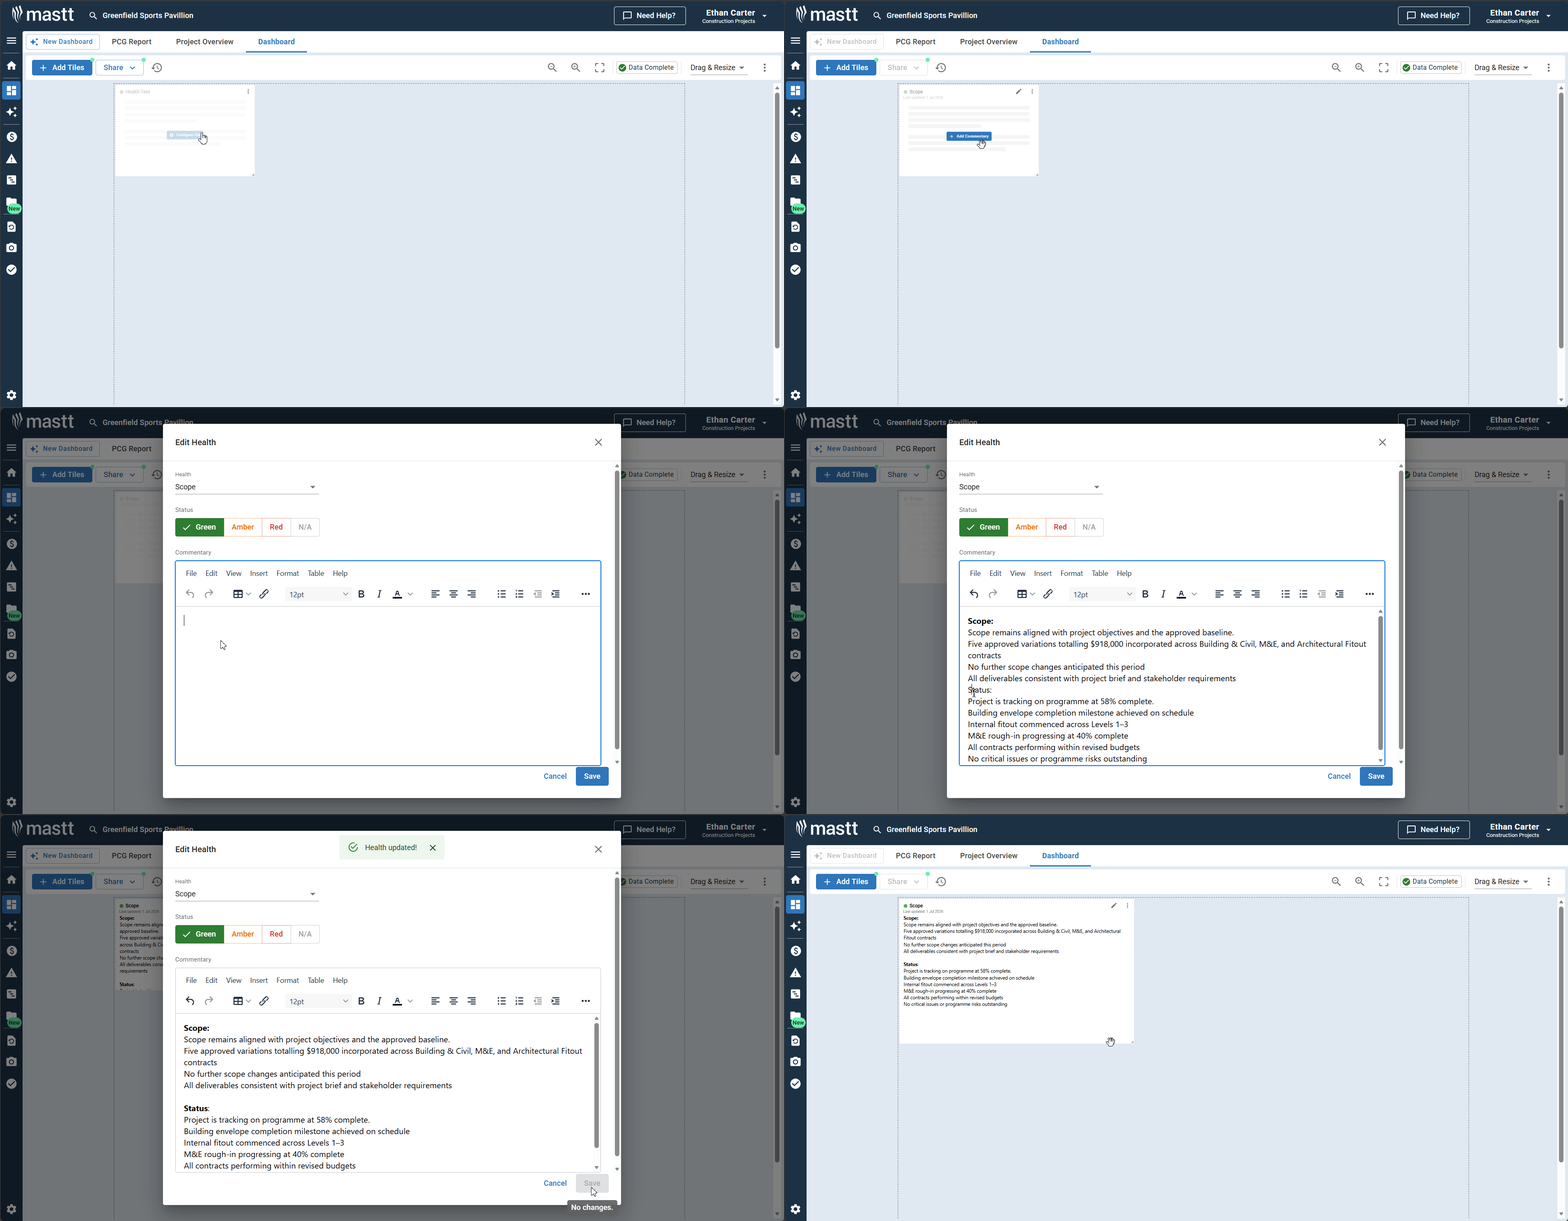
- Hover over the Health Text tile.
- Click the Action button and select Settings, or click Configure Tile in the centre of an empty tile.
- Choose which health category to display (scope, time, cost, risk, safety, quality, or cash flow).
- Click Save.
- To add a description, click the Edit button beside the Action button, or click + Add Commentary in the centre of the tile.
- Choose a health status and add your commentary using the rich text editor.
- Click Save.
Health Rings tile
| Display option | What it does |
|---|---|
| Wrap rings | Fills available space |
| Hide labels | Removes category names |
| Show status | Displays status text instead of category names |
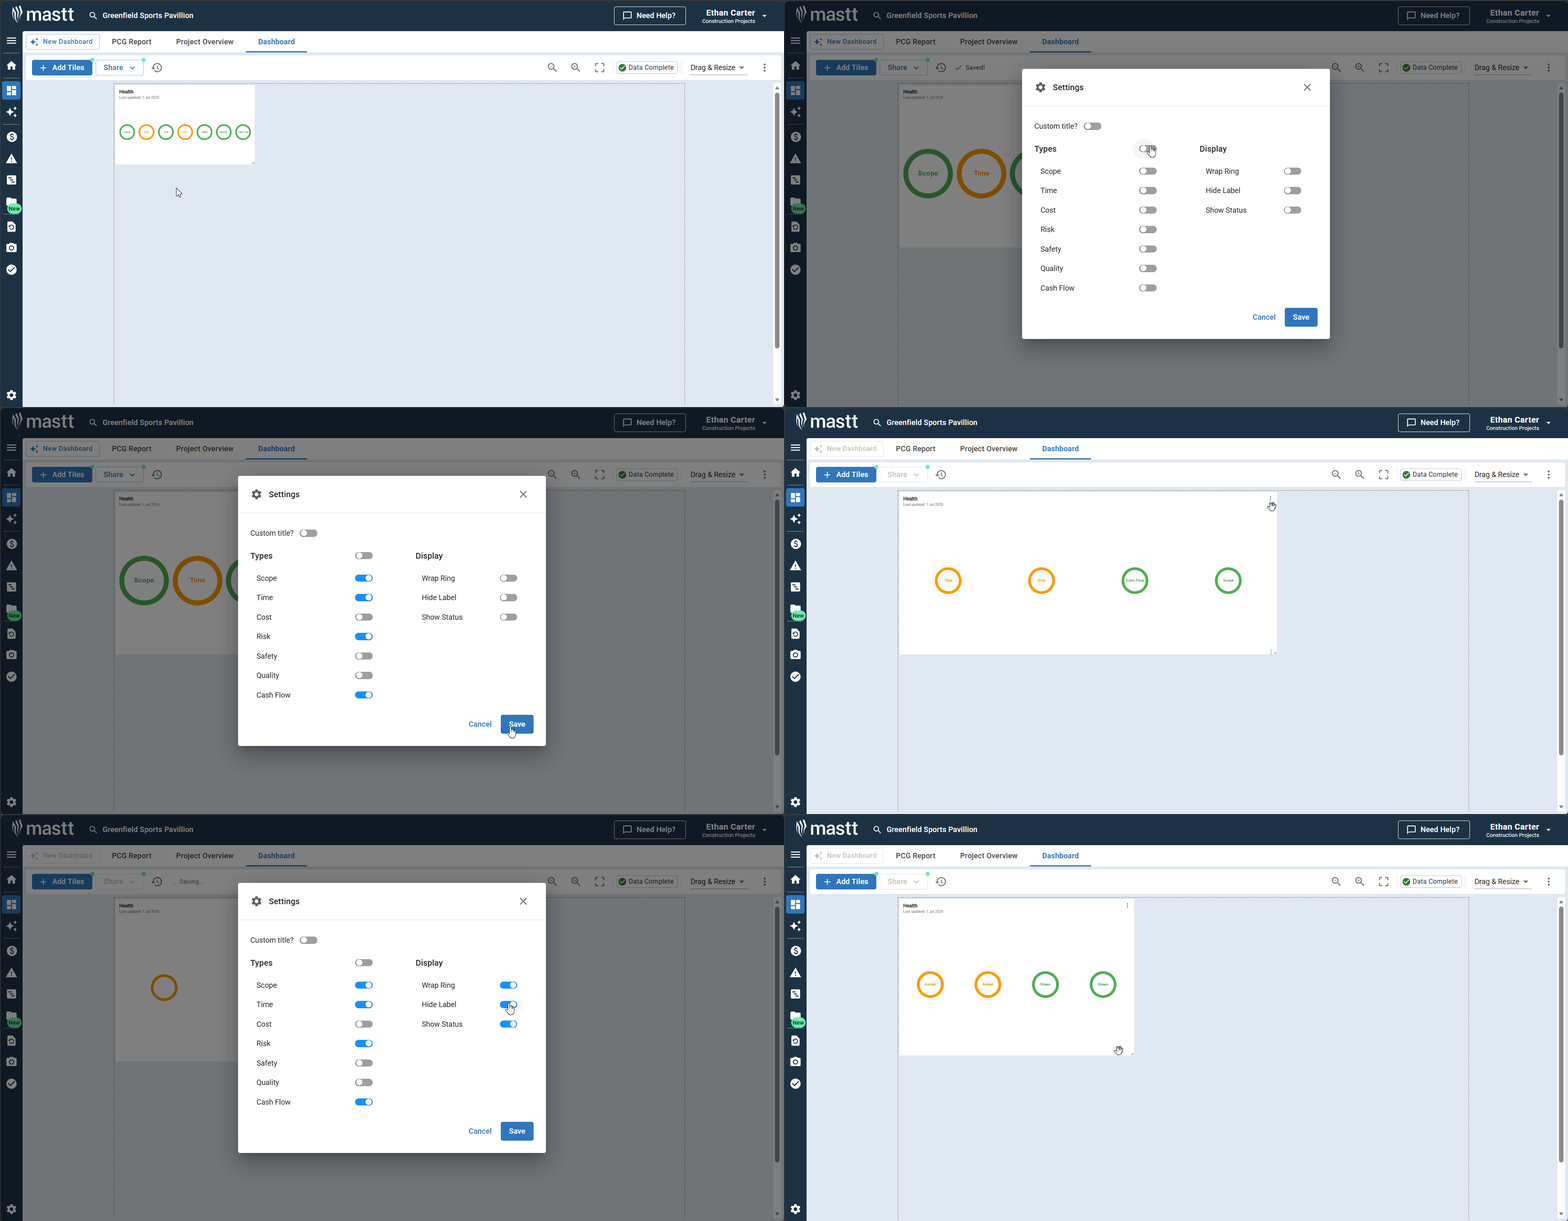
- Hover over the Health Rings tile and click the Action button.
- Select Settings.
- Toggle health categories on or off using the radio buttons under Types.
- Choose your display options (see the table above).
- Click Save.
Health Compare tile
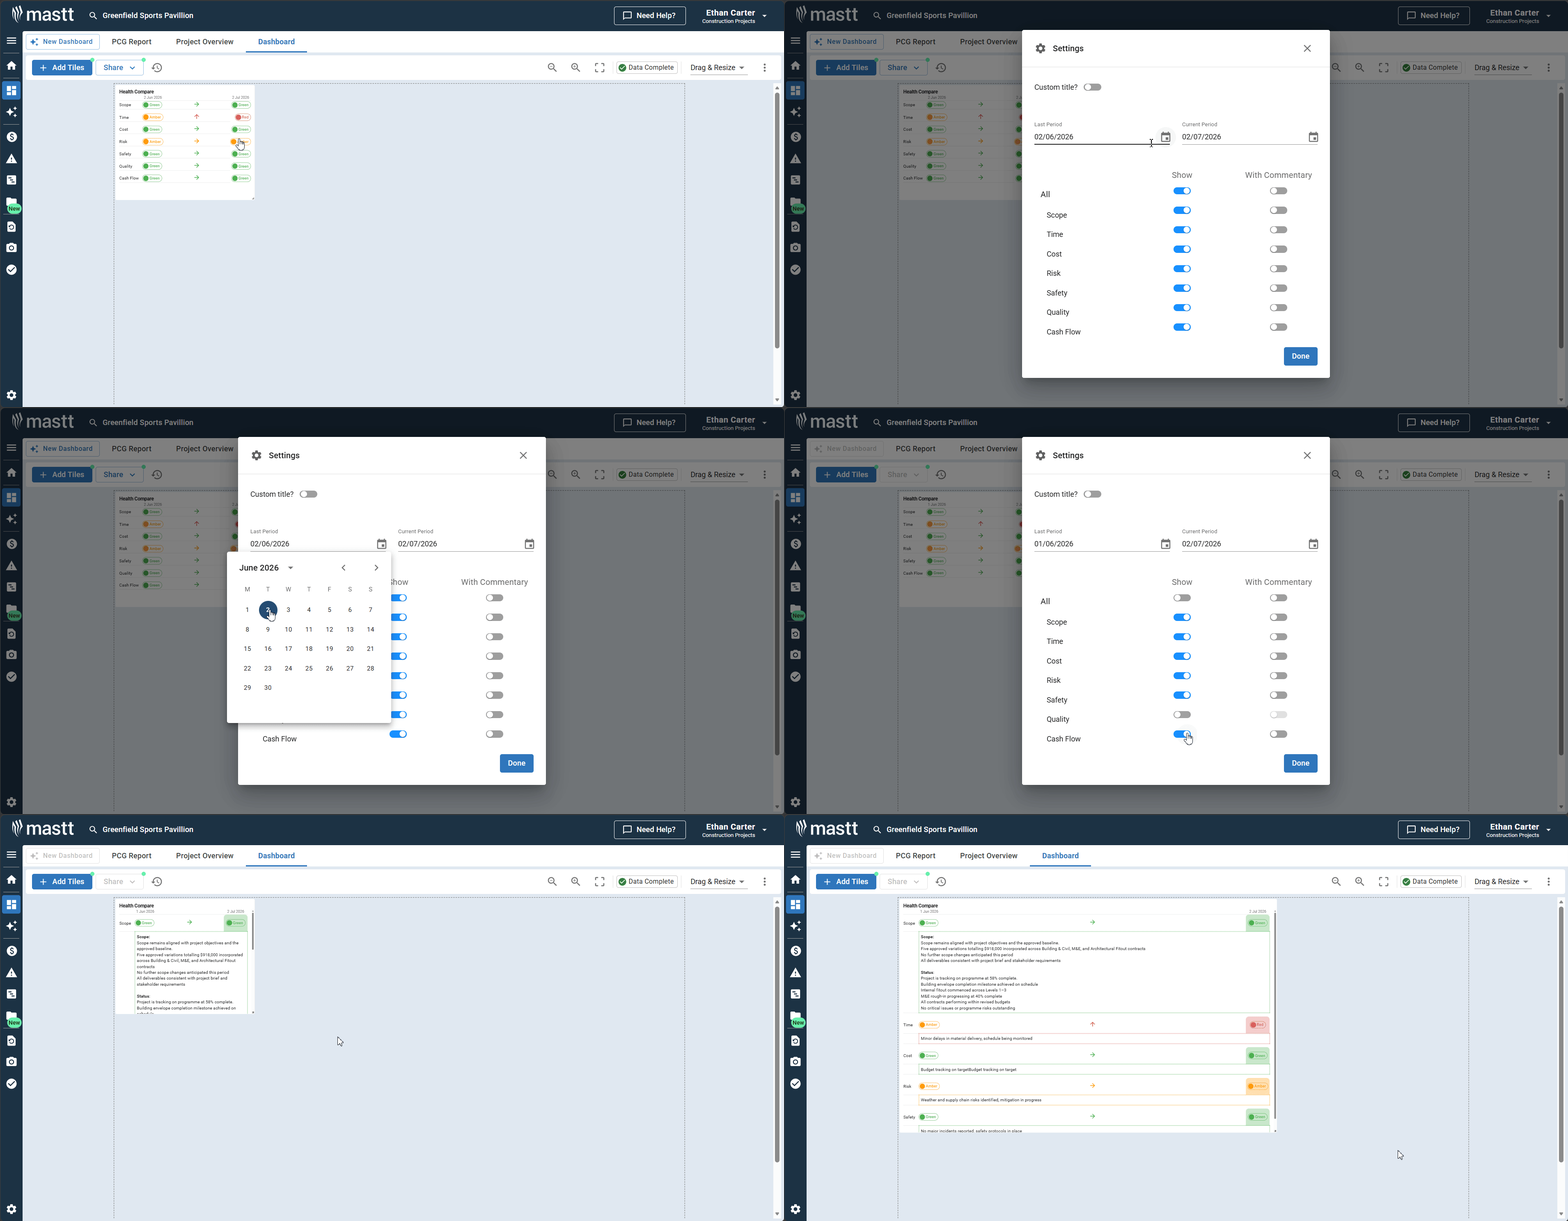
- Click the Action button on the Health Compare tile.
- Select Settings.
- Set the Last Period date using the date picker.
- Set the Current Period date using the date picker.
- Toggle which health categories to display.
- Enable With Commentary to include health update text.
- Click Save.
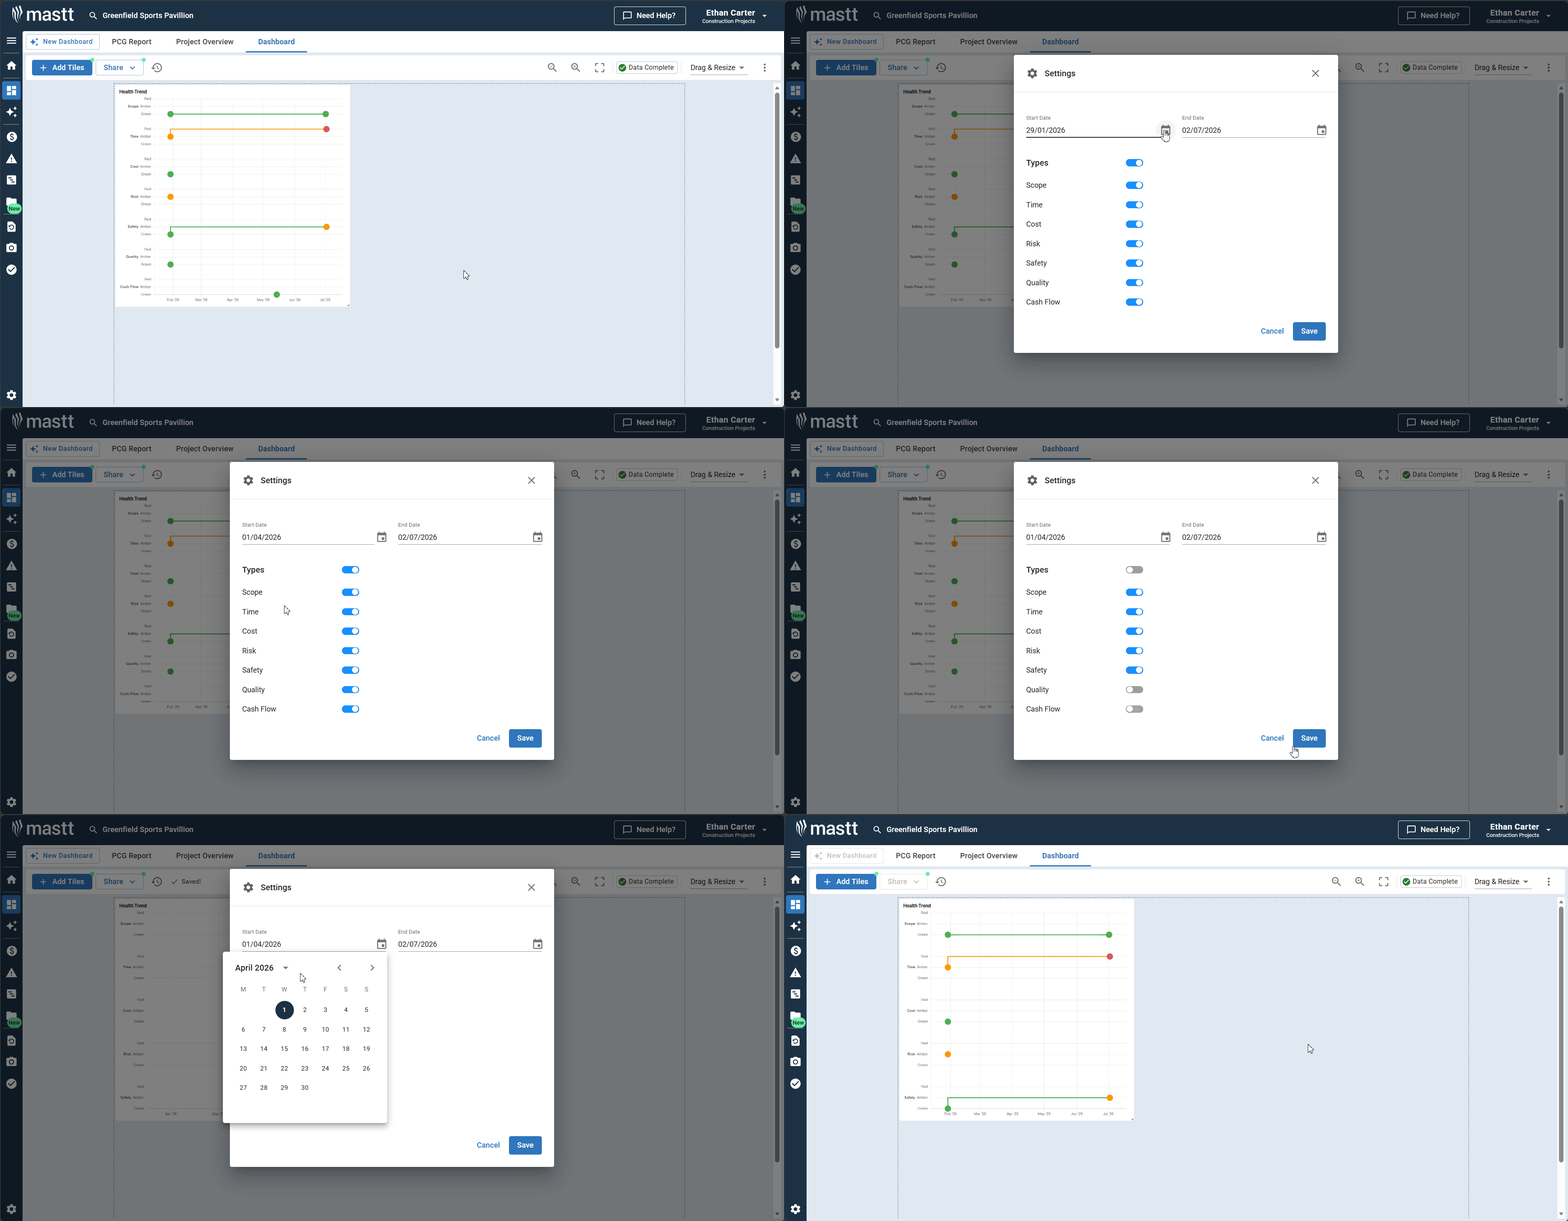
Health Trend tile
- Click the Action button on the Health Trend tile.
- Select Settings.
- Set the Start Date and End Date for the trend analysis.
- Select which health categories to display on the trend chart.
- Click Save.
Update health status and commentary
Health status and commentary are shared across all health tile types. When you update a category's status, the change appears on every health tile that shows that category.
| Status | What it means |
|---|---|
| Green | On track |
| Amber | At risk |
| Red | Critical |
| N/A | Not applicable |
- Hover over any health tile and click the Action button.
- Select Edit Health.
- Choose a health status from the dropdown (see the table above).
- Add detailed commentary using the rich text editor.
- Click Save to update the health category.
- Use the dropdown at the top to switch between categories and update multiple metrics in one session.
- Click X in the top right corner when finished.
Tip: For a comprehensive view of project health alongside dashboard tiles, see How to Create and Manage Dashboards.
Troubleshooting and FAQs
What if the health tile shows "no health chosen"?
Open the tile's Settings via the Action button and select a health category from the dropdown.
Why isn't the Health Compare tile showing data?
Make sure you have entered health updates for both selected time periods. The tile can only compare periods that have existing health data.
Can I update multiple health categories without closing the editor?
Yes. In the Edit Health view, use the dropdown at the top to switch between categories. Each category saves independently when you click Save.
Need help?
Contact Mastt Support for additional assistance with dashboard health tiles.