
KPI tiles are Dashboard elements that display individual key metrics and keep track of all project financials at a glance. They can pull data automatically from the Cost module or display custom values you enter manually, highlighting metrics such as Budget, Estimate at Completion, Original Contract Value, or Approved Change Orders. Each metric option includes a short description to help you select the right one.
Before you start
- Enter cost information in the Cost module to display Cost module data on KPI tiles.
- Go to Project Settings or Program Settings to configure the currency symbol for your project.
Add a KPI tile
- Go to your project Dashboard.
- Click + Add Tiles in the top left corner.
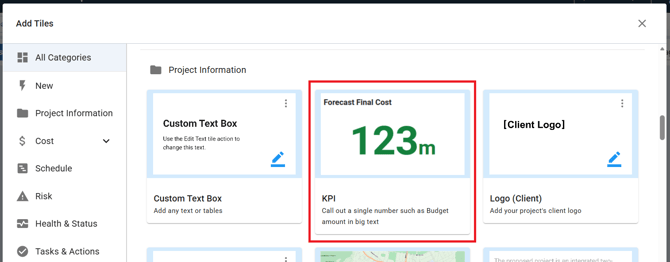
- Go to the KPI tile in the Tile Library.
- Click + Add Tile on the KPI card.
- Click the X to close the Tile Library panel.
The tile appears on your Dashboard with placeholder text until you configure it.
Configure a KPI tile
Open tile settings
- Click the Action button (⋮) in the top right corner of the tile.
- Select Settings from the dropdown menu.
Choose your data source
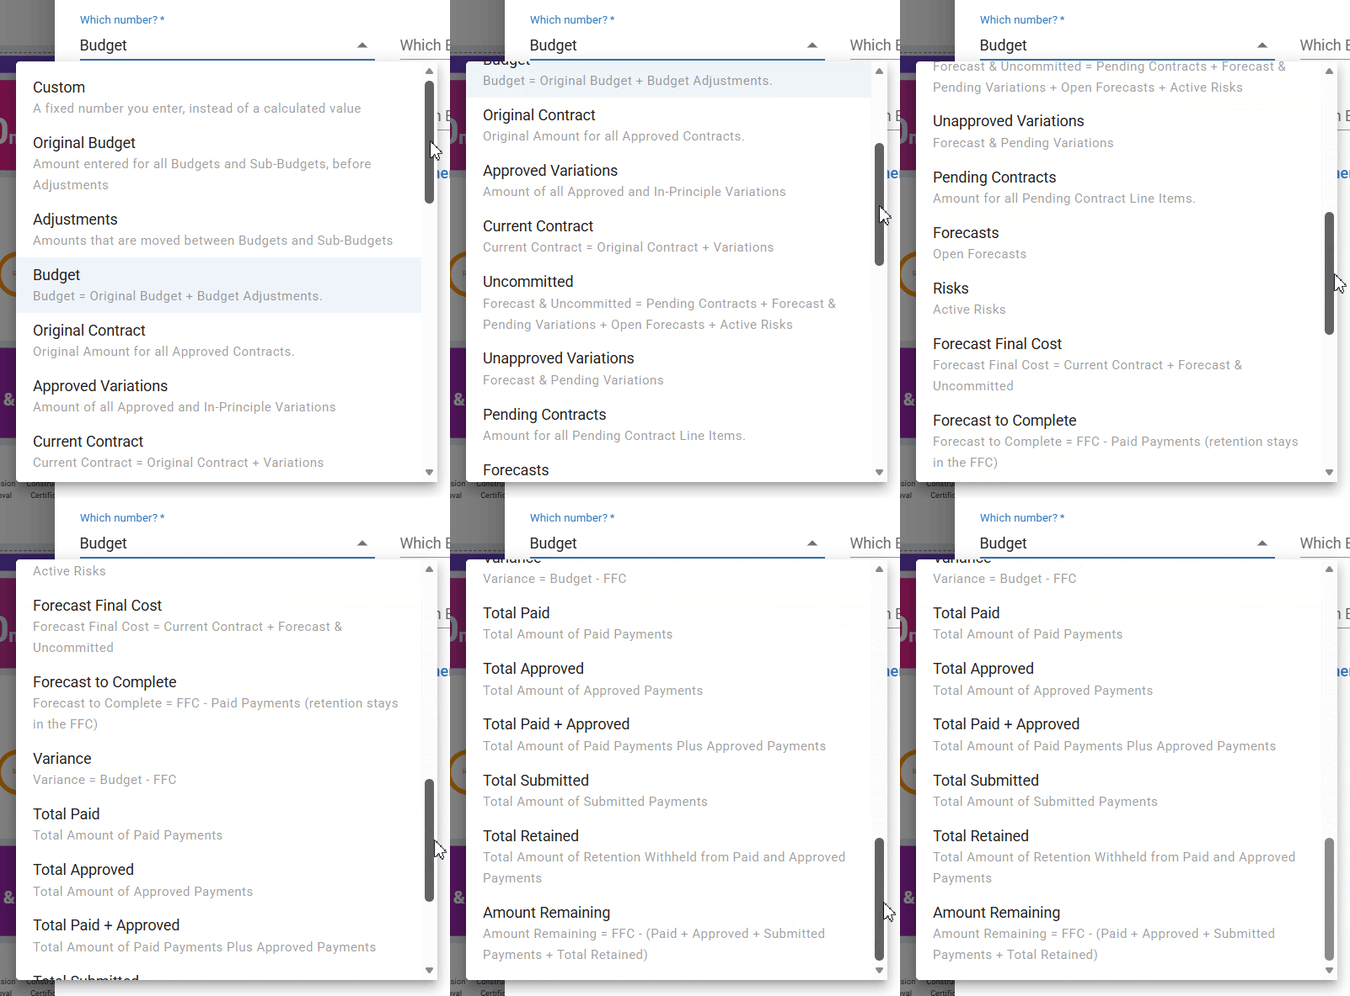
Under Which number?, select a metric.
| Option | What it does |
|---|---|
| Cost module metrics | Select from the values available in the dropdown. Each option includes a one-line description to help you identify the correct data source. These values update automatically as your project data changes. |
| Custom | Enter a manual value for numbers not sourced from the Cost module, such as external funding amounts or target values. |
Note: When you select a Cost module metric, additional filter fields appear. Use Which Budget? to filter by a specific budget, and Which Budget Tag? to filter by a budget category. Budget tags can be added during budget creation. See How to Create Budgets and Sub Budgets for details.
Add formulas (optional)
Use the Subtract or Add dropdown to combine with another number. When you add a second number, you can also filter it by specific budgets and budget tags.
Configure adjustments (optional)
When you select an Adjustments metric, additional options appear.
| Option | What it does |
|---|---|
| Which Adjustments? | Selects how adjustments are calculated (see the next table) |
| Include draft adjustments | Check this box to include draft (unapproved) adjustments in the calculation. This option is available for Adjustments only. |
| Which Adjustments? | What it includes |
|---|---|
| Net | Amounts that are moved in and out of Budgets and Sub-Budgets |
| In | Amounts that are moved into Budgets and Sub-Budgets |
| Out | Amounts that are moved out of Budgets and Sub-Budgets |
Configure display settings
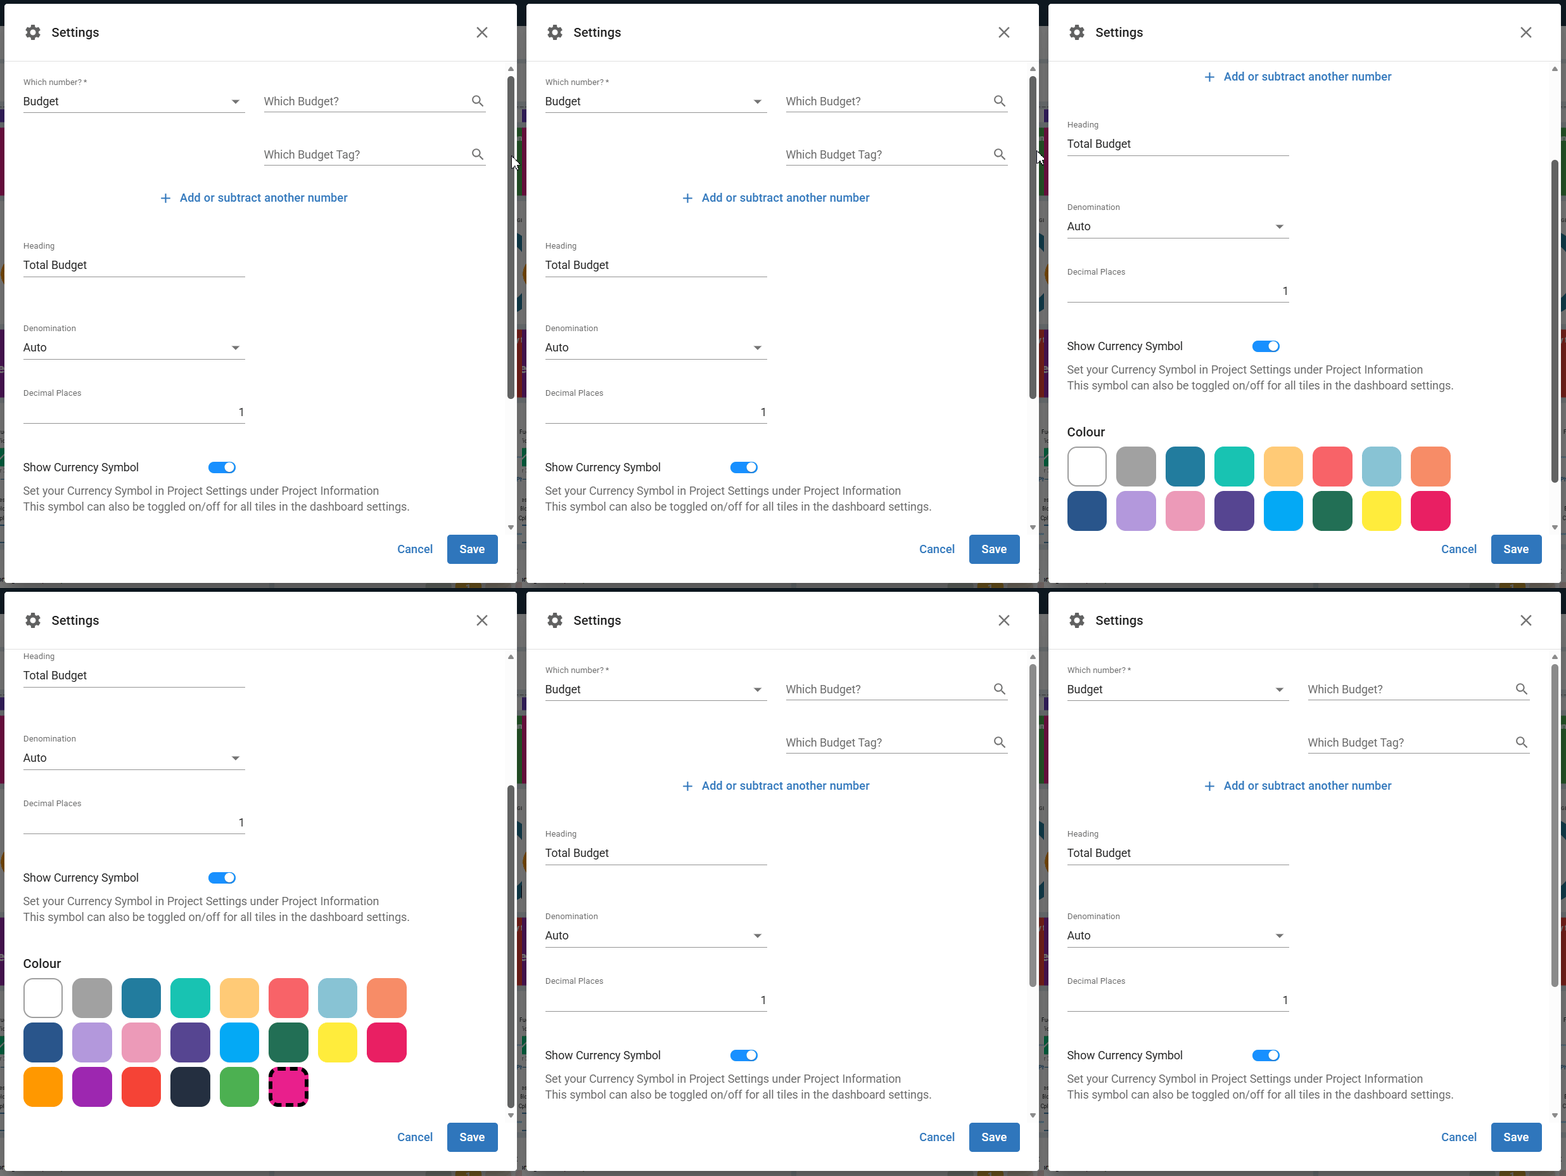
- Enter a Heading to display above the number.
- Select a Denomination to abbreviate the value (see the table below).
- Set the number of Decimal Places.
- Set the Show currency symbol toggle to on to display the currency symbol from your project settings.
- Select a Color for the tile background.
- Click Save.
| Denomination | What it shows |
|---|---|
| None | The full number |
| Thousands | The value abbreviated in thousands |
| Millions | The value abbreviated in millions |
Show currency symbols on KPI tiles
Enable for individual tiles
- Click the Action button (⋮) on the KPI tile.
- Select Settings.
- Set the Show currency symbol toggle to on.
- Click Save.
Repeat for each tile that requires a currency symbol.
Enable for all tiles at once
- Click the Action button in the top-right corner of the Dashboard page.
- Select Settings.
- Set the Show currency symbol for all tiles toggle to on.
- Click Done.
All KPI tiles on the Dashboard now display the currency symbol.
Manage KPI tiles
Click the Action button (⋮) on a tile to access the following actions.
| Action | What it does |
|---|---|
| Edit Data | Mastt navigates to the related Cost module section that contains the underlying data. Changes you make to the project data will be reflected on the Dashboard tile when you return. |
| Duplicate Tile | A copy of the tile appears with identical settings. Configure the duplicated tile through its Settings as needed. |
| Download Tile | The tile downloads as an image file for use in presentations, documents, or reports. |
| Remove Tile | Click Confirm if prompted. Removing a tile only removes the visual element from the Dashboard. The underlying data in the Cost module remains intact. To restore the tile, add a new KPI tile from the Tile Library and configure it again. |
Troubleshooting and FAQs
Why is my currency symbol not showing on the tile?
Check that a currency symbol is configured in Project Settings under Project Information. Make sure the toggle is enabled in the individual tile settings or in Dashboard Settings.
Can I show different currencies on different tiles?
No. All KPI tiles display the currency symbol set at the project level. For multi-currency projects, use the tile heading to clarify the currency.
Where did the Big Number tile go?
The Big Number tile has been renamed to KPI. It has the same functionality plus additional metric options. You can find it in the Tile Library under its new name.
Need help?
Contact Mastt Support for additional assistance with KPI tiles and Dashboard configuration.