Dashboard reports help you visualise project performance data and share insights with stakeholders. Use this feature when you need to monitor multiple project metrics in one view or generate reports for client presentations.
Before You Start
- Ensure you have access to your project in Mastt
Creating Your Dashboard
Navigate to the Dashboard
- Go to your project or programme — you'll land on the Dashboard tab by default
- Click + New Dashboard in the upper left corner
You'll see three options for creating your dashboard: Create with AI, Browse Templates, and Blank Canvas.
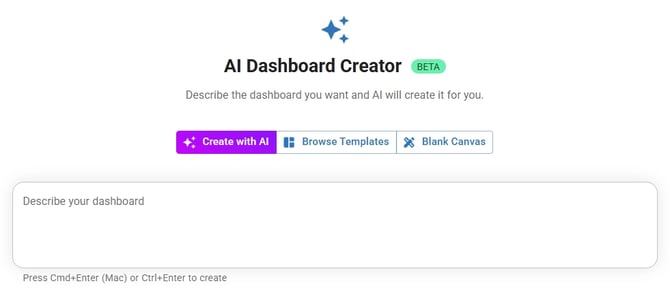
Create with AI
- Click Create with AI to open the AI Dashboard Creator
- Describe the dashboard you want in the text field, or select one of the sample prompts (e.g., "Create a simple project cost/budget report")
- Set the Number of pages for your dashboard
- Click Create Dashboard to generate your dashboard automatically
New to AI dashboards? Learn how intelligent automation can build the perfect dashboard for your project in minutes — see How to Use the AI Dashboard Creator.
Browse Templates
- Click Browse Templates to view available options
- Choose from three template categories:
- All Templates — complete library of available templates
- My Workspace — templates saved to your workspace
- Mastt Templates — templates from the Mastt library
- You can also type in the search bar what type of template or dashboard you're looking for and Mastt will show you options when available
- Click View Template to preview any template
- Review the template details including template type and purpose, what it's great for, included components, and usage examples
- Click Use Template at the bottom right of the preview window
- Mastt will automatically create the dashboard with pre-configured tiles
Blank Canvas
- Click Blank Canvas to create an empty dashboard
- Add tiles manually using the + Add Tiles button
Customising Your Dashboard
Adjust Layout and Views
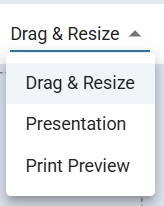
Use the controls in the right-hand corner to access layout options:
- Drag and resize tiles — move, edit, and resize dashboard elements to customise your layout
- Presentation Mode — lock tiles in position for client presentations
- Print Preview — display dotted outlines around each page section
Your changes are saved automatically.
Exporting and Sharing Your Dashboard
Download as PDF
- Make any final adjustments to your dashboard — changes are saved automatically
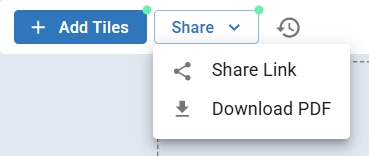
- Click the Share dropdown beside Add Tiles
- Select Download PDF to export your dashboard as a PDF file
Your PDF is now ready for sharing with clients or stakeholders.
Share a Live Dashboard Link
You can also select Share Link from the same Share dropdown to generate a shareable link for external stakeholders — no Mastt account required for recipients. For full instructions, see How to Share a Dashboard Link.
Create workspace templates for frequently used dashboard layouts to save time on future projects. Refer to How to Create Custom Dashboard Templates for a detailed guide.
Troubleshooting & FAQs
Q: Why does my dashboard look different in the PDF compared to the screen?
Use Print Preview mode before downloading to see exactly how each page will appear. Adjust tile sizes and positions as needed.
Q: How do I save a dashboard layout as a template for future use?
Refer to How to Create Custom Dashboard Templates for a detailed guide on creating workspace templates.
Need Help?
Contact Mastt Support for additional assistance with dashboard creation and PDF reports.